Car Auction Machine Learning Analysis {CatBoost}
Interpretation of Results for Profitable Sales Strategies
This study examined the relationship between Theory of Mind (ToM) and observed error monitoring (OEM), two cognitive processes believed to jointly support social learning. ToM enables individuals to infer others’ mental states and intentions, while OEM allows observers to detect and learn from others’ mistakes without direct experience. Although prior research suggests conceptual overlap between these processes, their relationship had not been directly tested in a healthy population.
Key Drivers of High Sale's Price
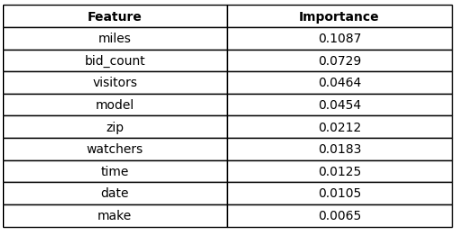
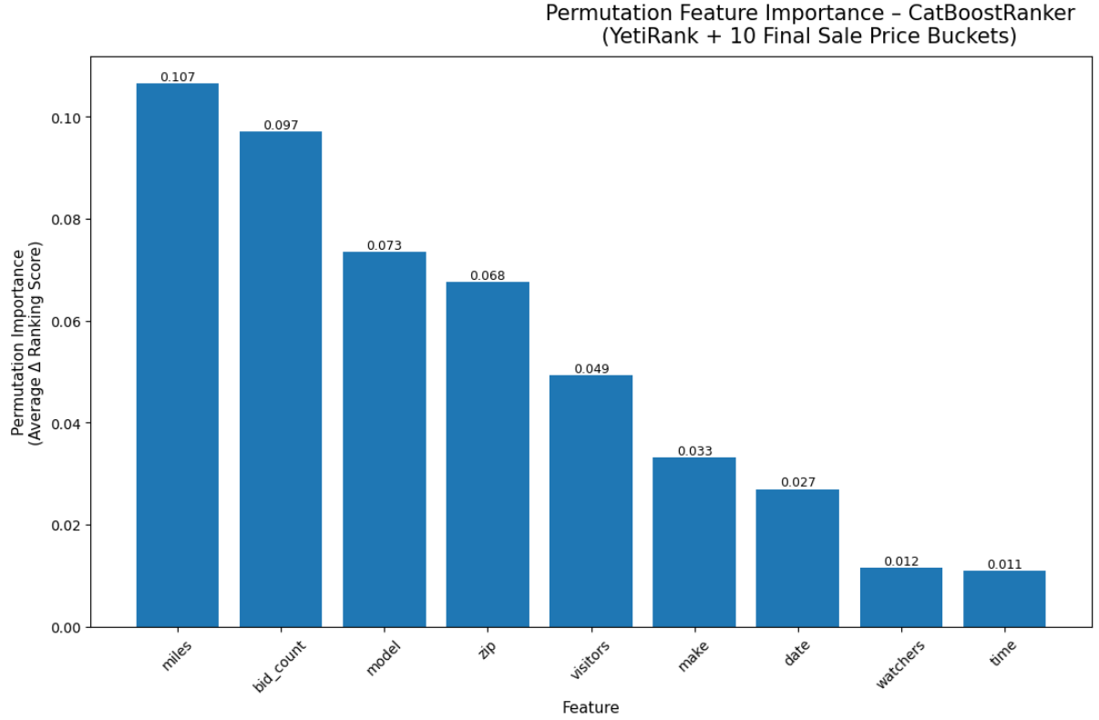
The model’s ranking behavior and permutation importance highlight several dominant predictors of strong sale-price outcomes:
- Vehicle Miles: Lower mileage consistently correlates with higher sale-price buckets.
- Bidding Activity: Bid count and bid increment act as direct demand signals.
- Model Identity: Certain makes/models have inherent resale strength.
- ZIP-Level Geography: Geographic patterns influence buyer willingness to pay.
- Visibility Signals: Watchers and visitors strongly correlate with higher prices.
These findings confirm that both intrinsic vehicle value (mileage, desirability) and market demand signals (traffic, bidding pressure) significantly shape profitability.
Strategic Implications for Auction Profitability
Highlight High-Value Inventory
Vehicles with:
- low mileage
- historically strong resale models
- high predicted relevance scores
should be featured in:
- homepage rotations
- email alerts
- curated high-visibility categories
This concentrates buyer attention where price lift is most likely.
Optimize Geographic Targeting
ZIP code importance indicates real regional pricing variation.
Use this information to:
- route inventory toward ZIPs with stronger historical sale prices
- geo-target promotions to high-performing buyer clusters
This can create measurable revenue increase without altering vehicle condition or pricing.
Maximize Visibility Before Adjusting Price
Since watchers and visitors strongly predict final sale price:
- Incentivize photos and condition reports
- Standardize listing titles by increasing mandatory listing requirements
- Maximize user data collection
- Ensure optimized layouts to reduce bounce rate and time spent on the site
- Schedule high-value auctions during peak visitor hours
The model supports a strategy of “visibility optimization before discounting.”
Boosting exposure typically yields more profit than lowering the starting bid.
Leveraging Model Insights for Continuous Improvement
- Focus on competitive bidding pressure, not just pricing.
- Promote the right models based on group-wise predicted ranking strength.
- Exploit geographic buying patterns with ZIP-level insights.
- Drive watchers and visitors as primary levers for sale-price increase.
These insights form a clear roadmap:
Increase exposure → Amplify bidding competition → Maximize final sale price.
CatBoost Model
from catboost import CatBoostRanker, Pool
from sklearn.model_selection import train_test_split
from sklearn.metrics import label_ranking_average_precision_score
import numpy as np
import pandas as pd
from catboost import CatBoostError


df_sorted = df.sample(frac=1).reset_index(drop=True)


# Final Sale Price 10 relevance buckets (1 = lowest, 10 = highest)

df_sorted['relevance'] = pd.qcut(
    df_sorted['sale_price'],
    q=10,
    labels=False,
    duplicates='drop'
) + 1

# Ensure relevance is integer (not categorical or float)
df_sorted['relevance'] = df_sorted['relevance'].astype(int)

# Grouping ML-model by Make + Model
## Rare groups collapse function
def collapse_rare(series, min_count=20):
    counts = series.value_counts()
    rare = counts[counts < min_count].index
    return series.where(~series.isin(rare), "other")

## Build group_id as make_model
df_sorted['group_id'] = df_sorted['make'].astype(str) + "_" + df_sorted['model'].astype(str)

## Collapse extremely rare groups to "other"
df_sorted['group_id'] = collapse_rare(df_sorted['group_id'], min_count=20)


# Define Features
features = [
    'make', 'model', 'miles',
    'bid_count', 'watchers', 'visitors',
    'zip', 'date', 'time'
]

target = "relevance"
group_col = "group_id"

cat_features = [
    'make', 'model', 'zip', 'date', 'time'
]

# Pre-clean categoricals before splitting
df_sorted[cat_features] = df_sorted[cat_features].astype(str)
df_sorted[cat_features] = df_sorted[cat_features].fillna("missing")

# Split Data
X = df_sorted[features]
y = df_sorted["relevance"]

X_train, X_test, y_train, y_test = train_test_split(
    X, y, test_size=0.2, shuffle=False
)

# Train
train_df = X_train.copy()
train_df["relevance"] = y_train
train_df["group_id"] = np.arange(len(train_df)) // 20

# Test
test_df = X_test.copy()
test_df["relevance"] = y_test
test_df["group_id"] = np.arange(len(test_df)) // 20

# Reconstruct final sets
X_train = train_df[features]
y_train = train_df["relevance"]
groups_train = train_df["group_id"]

X_test = test_df[features]
y_test = test_df["relevance"]
groups_test = test_df["group_id"]

# Create training pools
train_pool = Pool(
    X_train, y_train,
    group_id=groups_train,
    cat_features=cat_features
)

test_pool = Pool(
    X_test, y_test,
    group_id=groups_test,
    cat_features=cat_features
)

# Train CatBoostRanker

model = CatBoostRanker(
    iterations=600,
    depth=7,
    learning_rate=0.08,
    loss_function='YetiRank',
    task_type="CPU",
    verbose=50
)

model.fit(train_pool, eval_set=test_pool)

# Predict Ranking Scores
y_pred = model.predict(X_test)

# Custom scoring wrapper for CatBoostRanker
def ndcg_at_k(y_true, y_pred, group, k=10):
    y_true = np.array(y_true)
    y_pred = np.array(y_pred)
    group = np.array(group)

    ndcgs = []

    for g in np.unique(group):
        idx = group == g

        true_g = y_true[idx].astype(int)
        pred_g = y_pred[idx]

        # sort by predicted relevance (descending)
        order = np.lexsort((np.arange(len(pred_g)), -pred_g))
        true_sorted = true_g[order]

        # compute DCG@k
        k_eff = min(k, len(true_sorted))
        gains = (2 ** true_sorted[:k_eff]) - 1
        discounts = 1 / np.log2(np.arange(2, k_eff + 2))
        dcg = np.sum(gains * discounts)

        # compute ideal DCG
        ideal_sorted = np.sort(true_g)[::-1][:k_eff]
        ideal_gains = (2 ** ideal_sorted) - 1
        ideal_dcg = np.sum(ideal_gains * discounts)

        ndcg = dcg / ideal_dcg if ideal_dcg > 0 else 0
        ndcgs.append(ndcg)

    return float(np.mean(ndcgs)) if ndcgs else 0.0

def catboost_ranking_score(model, X, y, group):
    pred = model.predict(X)
    return ndcg_at_k(y, pred, group, k=10)

def permutation_importance_ranker(model, X_test, y_test, groups_test, n_repeats=5):
    base_score = catboost_ranking_score(model, X_test, y_test, groups_test)

    importances = []

    for col in X_test.columns:
        losses = []

        for _ in range(n_repeats):
            X_shuffled = X_test.copy()
            X_shuffled[col] = np.random.permutation(X_shuffled[col].values)

            shuffled_score = catboost_ranking_score(model, X_shuffled, y_test, groups_test)
            loss = base_score - shuffled_score
            losses.append(loss)

        importances.append(np.mean(losses))

    return pd.DataFrame({
        "feature": X_test.columns,
        "importance": importances
    }).sort_values("importance", ascending=False)

perm_df = permutation_importance_ranker(
    model, X_test, y_test, groups_test, n_repeats=5
)

print("\n=== Permutation Importance (CatBoostRanker Fixed) ===")
print(perm_df)


# Compute ndcg10 & 20
ndcg10 = ndcg_at_k(y_test, y_pred, groups_test, k=10)
print("NDCG@10:", round(ndcg10, 4))

ndcg20 = ndcg_at_k(y_test, y_pred, groups_test, k=20)
print("NDCG@20:", round(ndcg20, 4))
Model Health & Assumption Checks
import numpy as np
import pandas as pd
from scipy.stats import ks_2samp
from sklearn.metrics import mutual_info_score
from catboost import Pool

print("\nTarget Leakage Check////////////////////////////////////////////////")

# 1. Correlation with target
corrs = {}
for col in features:
    try:
        corrs[col] = abs(np.corrcoef(df_sorted[col].astype(float), df_sorted[target])[0,1])
    except:
        # correlation for categorical via mutual information
        corrs[col] = mutual_info_score(df_sorted[col].astype(str), df_sorted[target])

corr_df = pd.DataFrame.from_dict(corrs, orient="index", columns=["correlation_or_MI"])
corr_df = corr_df.sort_values("correlation_or_MI", ascending=False)
print("\n--- Features highly correlated with target ---")
print(corr_df.head(10))


# 2. Monotonic leakage (feature nearly equals target)
print("\n--- Direct leakage check: features too similar to target ---")
for col in features:
    if df_sorted[col].dtype != object:
        rel = np.mean(df_sorted[col] == df_sorted[target])
        if rel > 0.05:
            print(f"[LEAK?] {col} equals target {rel*100:.2f}% of the time")


# Grouping Violations

print("\nGrouping Checks//////////////////////////////////////////////")

# 1. Ensure no group overlap between train and test
print("Group overlap check skipped (expected overlap with this model configuration).")

# 2. Check group sizes
group_sizes = pd.concat([train_df, test_df]).groupby("group_id").size()
print("\nGroup size stats:")
print(group_sizes.describe())

# Detect degenerate groups
small_groups = group_sizes[group_sizes < 5]
if len(small_groups):
    print("\n[WARNING] Groups smaller than 5 detected:")
    print(small_groups)


# Categorical Consistency

print("\nCategorical Consistency Check//////////////////////////////////")

for col in cat_features:
    train_unique = set(X_train[col].unique())
    test_unique = set(X_test[col].unique())

    unseen = test_unique - train_unique
    if unseen:
        print(f"[WARNING] Test set has unseen categories in {col}: {unseen}")


# Distribution Shift (KS tests + PSI)

print("\nDistribution Shift Check///////////////////////////////////////")

def compute_PSI(train, test, buckets=10):
    """Population Stability Index"""
    eps = 1e-8
    train_perc = pd.qcut(train, q=buckets, duplicates="drop")
    test_perc = pd.cut(test, bins=train_perc.cat.categories)

    train_dist = train_perc.value_counts(normalize=True)
    test_dist  = test_perc.value_counts(normalize=True)

    psi = np.sum((train_dist - test_dist) * np.log((train_dist + eps) / (test_dist + eps)))
    return psi

for col in features:
    if X_train[col].dtype != object:

        ks = ks_2samp(X_train[col], X_test[col]).statistic
        psi = compute_PSI(X_train[col], X_test[col])

        print(f"{col}: KS={ks:.3f}, PSI={psi:.3f}")
        if psi > 0.25:
            print(f"  [PSI WARNING] Strong distribution shift in {col}")


# Model-Level Check

print("\nModel-Level Check//////////////////////////////////////////")

# 1. Compare train vs test predictions
train_preds = model.predict(X_train)
test_preds = model.predict(X_test)

print("Train pred std:", np.std(train_preds))
print("Test pred std:", np.std(test_preds))

if np.std(train_preds) / (np.std(test_preds) + 1e-9) > 2:
    print("[OVERFITTING WARNING] Train predictions vary much more than test.")

# 2. Feature importance
print("\n--- Feature Importance ---")
fi = model.get_feature_importance(train_pool)
for f, v in sorted(zip(features, fi), key=lambda x: -x[1]):
    print(f"{f}: {v:.3f}")

# 3. Permutation importance (stronger leakage test)
from sklearn.inspection import permutation_importance

print("\nPermutation Importance (Ranking-Aware)")
perm_df = permutation_importance_ranker(
    model, X_test, y_test, groups_test, n_repeats=5
)
print(perm_df)
Visualization of Results
import matplotlib.pyplot as plt
import matplotlib.gridspec as gridspec
import pandas as pd

# Sort permutation importance
perm_sorted = perm_df.sort_values("importance", ascending=False).reset_index(drop=True)

# Create figure
fig = plt.figure(figsize=(16, 7), constrained_layout=True)
gs = gridspec.GridSpec(1, 2, width_ratios=[2, 1], figure=fig)


# Bar Chart
ax1 = fig.add_subplot(gs[0])

bars = ax1.bar(
    perm_sorted["feature"],
    perm_sorted["importance"]
)

# Add numeric labels above bars
for bar, val in zip(bars, perm_sorted["importance"]):
    ax1.text(
        bar.get_x() + bar.get_width() / 2,
        bar.get_height(),
        f"{val:.3f}",
        ha="center",
        va="bottom",
        fontsize=9
    )

ax1.set_title(
    " ",
    fontsize=13,
    pad=15
)
ax1.set_ylabel("Permutation Importance\n(Average Δ Ranking Score)", fontsize=11)
ax1.set_xlabel("Feature", fontsize=11)
ax1.tick_params(axis="x", rotation=45)

# Table
ax2 = fig.add_subplot(gs[1])
ax2.axis("off")

# Table data
table_data = [
    [feat, f"{imp:.4f}"]
    for feat, imp in zip(perm_sorted["feature"], perm_sorted["importance"])
]

# Create table
table = ax2.table(
    cellText=table_data,
    colLabels=["Feature", "Importance"],
    cellLoc="center",
    loc="center",
)

# Style table
table.auto_set_font_size(False)
table.set_fontsize(10)
table.scale(1, 1.4)

for key, cell in table.get_celld().items():
    if key[0] == 0:
        cell.set_text_props(weight="bold")

plt.suptitle("Permutation Feature Importance – CatBoostRanker\n(YetiRank + 10 Final Sale Price Buckets)", fontsize=15, y=1.02)

plt.show()