
PWC Acceleration Center Index
Aim of the Index
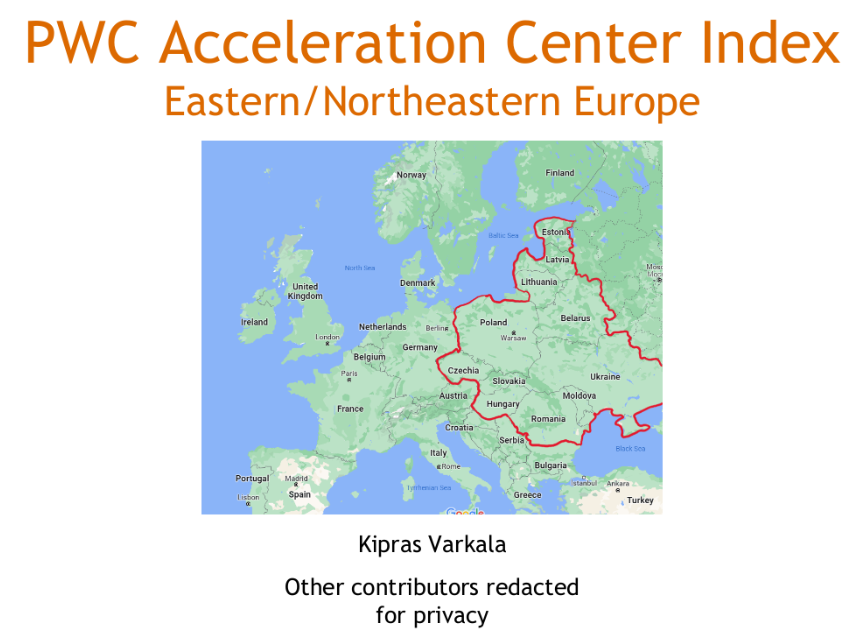
The PwC Acceleration Center (AC) Index was developed as a systematic, data-driven framework to evaluate and compare potential locations for future PwC Acceleration Centers across Eastern and Northeastern Europe, a region not previously covered by PwC’s AC footprint.
Rather than identifying a predetermined “target city,” the primary aim was to:
- Create a repeatable and transparent decision support tool
- Assess relative strengths, tradeoffs, and risks across multiple countries and cities
- Enable leadership to compare locations under different strategic assumptions and weighting scenarios
The index was explicitly designed to inform evidence-based discussion, not to justify a specific outcome.
Strategic Rationale
PwC’s expansion strategy requires locations that balance:
- High-quality digital and professional talent
- Cost efficiency and economic stability
- Ease of operating a global professional services center
- Long-term scalability and workforce sustainability
Eastern and Northeastern Europe presented significant potential, but also heterogeneity across countries, making intuitive or anecdotal decision-making insufficient. The index addressed this gap by converting diverse macroeconomic, labor, and infrastructure indicators into a single analytical framework.
Developmental Philosophy
The AC Index was constructed with the assumption that:
- No single metric is decisive on its own
- Strong performance in one area may be offset by weaknesses in another
- Strategic priorities may shift over time
As a result, the methodology emphasized:
- Weighted multi-factor analysis rather than simple rankings
- Scenario testing, including models that both included and excluded income-related variables
- Sensitivity to how changes in business priorities (e.g., cost vs. talent depth) alter relative attractiveness
This approach ensured the index remained agnostic to outcomes and adaptable to future use.
*Data was extracted from publicly available archives and sources are noted in the index excel file
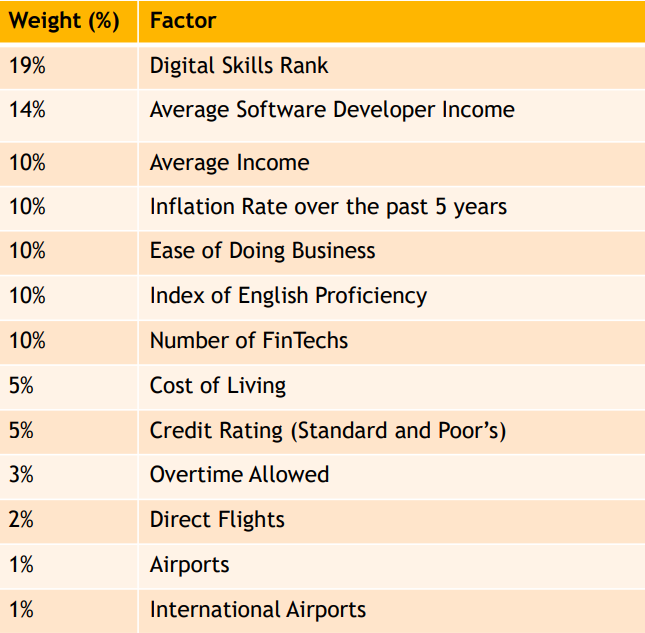
Index Factors Overview (% =weight)
The PwC Acceleration Center Index evaluates potential locations using a weighted set of workforce, economic, business environment, and infrastructure indicators designed to assess long-term operational viability and scalability.
Workforce & Talent Factors
1. Digital Skills Rank (19%)
- Measures the availability, quality, and resilience of digital and STEM skills within the local workforce, including education output, employer–talent alignment, and research intensity.
2. Index of English Proficiency (10%)
- Assesses population-level English language proficiency to evaluate readiness for global, client-facing professional services work.
3. Number of FinTechs (10%)
- Serves as a proxy for the maturity of the technology ecosystem and the availability of specialized digital and financial services talent.
Economic & Financial Factors
4. Average Software Developer Income (14%)
- Evaluates cost efficiency relative to technical skill availability by comparing average developer compensation across locations.
5. Average National Income (10%)
- Reflects overall economic conditions, purchasing power, and baseline wage expectations within the general population.
6. Inflation Rate (10%)
- Measures macroeconomic stability and cost predictability using the average inflation rate over the past five years.
7. Credit Rating – Standard & Poor’s (5%)
- Indicates sovereign creditworthiness and financial reliability based on internationally recognized credit ratings.
Business Environment Factors
8. Ease of Doing Business (10%)
- Assesses regulatory and administrative effort required to establish and operate a business, including taxation, contracts, and property registration.
9. Cost of Living (5%)
- Evaluates the balance between wages and living expenses to gauge workforce sustainability and long-term retention potential.
Labor & Cultural Factors
10. Overtime Allowed (3%)
- Captures legal limits on annual overtime hours as an indicator of labor flexibility and prevailing work culture norms.
Accessibility & Infrastructure Factors
11. Direct Flights (2%)
- Measures ease of international access for clients, leadership, and cross-office collaboration through direct air connections.
12. Number of Airports (1%)
- Accounts for overall air transport infrastructure availability within the country.
13. Number of International Airports (1%)
- Evaluates global connectivity through airports offering international flight operations.
The index was intentionally designed to function like a flexible calculator, where each factor is assigned a weight that can be adjusted to reflect changing business priorities such as cost efficiency, talent depth, or global accessibility.
By allowing weights to be recalibrated, the model enables decisionmakers to simulate different strategic scenarios and observe how location rankings shift based on what matters most to PWC at a given point in time.